
Interpret Maps & Determine Populations to Monitor
The Probability of Occurrence will be displayed on a gradient from 0 to 1, with 1
representing a 100% probability of occurrence. A 100% PO value does not mean that
there will necessarily be a target plant at that location, since occupation at any
one location is determined by both habitat AND propagule pressure. However, it does
indicate a higher likelihood of presence, and thus would be a good location to look
for the target species.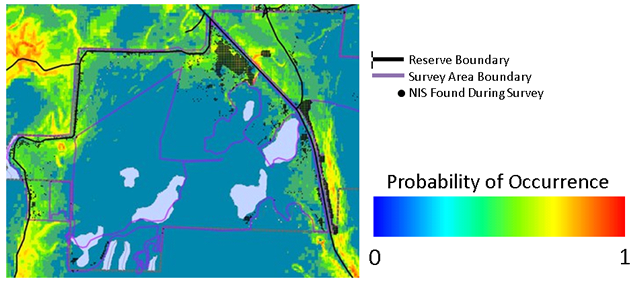
In general, there are two uses for PO map data:
1. Control efforts. The PO maps can be used to narrow - or prioritize - the areas to look in and control
for target species. This prioritization and reduction in the area to concentrate
on is possible because not all populations of any particular NIS species are invasive
(expanding in size or density). By concentrating on high PO locations, where patches
are typically more invasive and having more impact on the surrounding vegetation,
management can be more efficient and effective.
2. Strategic Monitoring. Strategic monitoring can be used to 1) help prioritize which species and populations
to target, and 2) determine the effectiveness of your control and management efforts.
By selecting populations along the entire PO gradient ( for objective 1) and/or your
PO management gradient (for objective 2) to monitor, you can determine which populations
are being most invasive (1), or best controlled by your management approaches (2).
For more information about monitoring, click here!