Monitoring to Detect New NIS Invasions
One of the most important types of monitoring that you can conduct is monitoring for new populations of NIS. This can be as simple as looking for new populations while conducting other activities in an area you have been to before, or investigating a new area. The PO risk maps give you an excellent way to make targeted observations based on the likelihood of finding the NIS in a particular area. A simple example of how this can be done is given below.
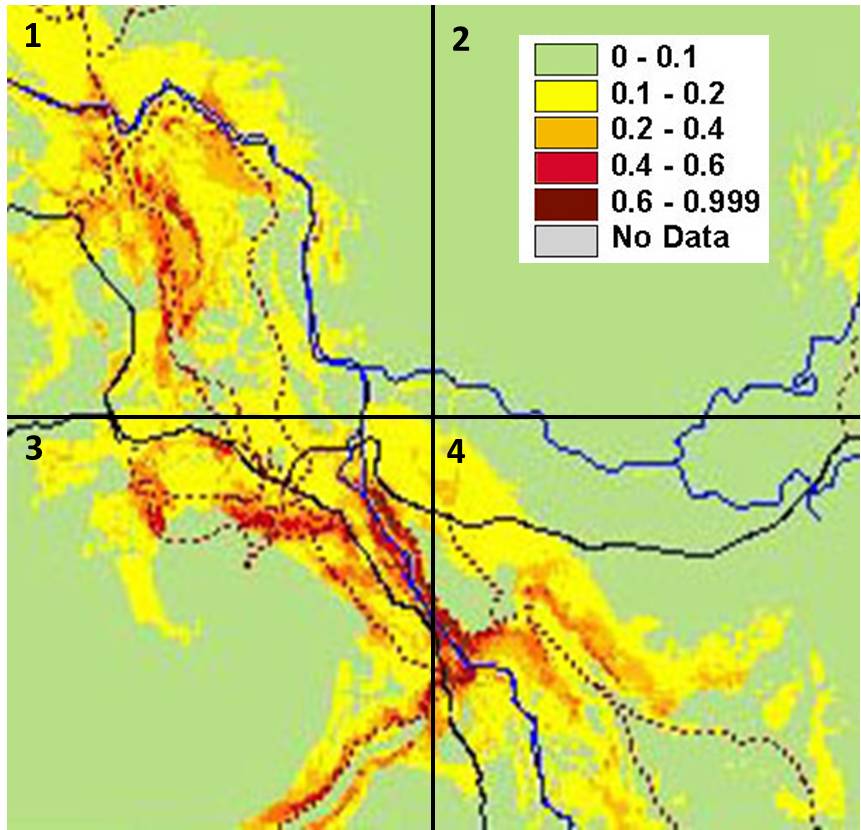
Figure 1, below, represents a probability of occurrence (PO) map for an NIS in a hypothetical four section management area. From the work that you did collecting the data to produce the map, you know that the NIS is only present in sections 3 and 4. However, you notice that there are several areas in section 1 that have a high probability of occurrence (the red and dark red colors). In monitoring for new populations, you should decide to prioritize and visit those areas in section 1 with higher PO values more often.